Back to the basic part

Advanced part

This section deals in detail with climatic niche modelling. The focus is on the climatic parameters used.

Climatic niche modeling

  • The basis for the model development are the habitats of the individual species over a period of about 30 years, e.g. from 1971 to 2000.
  • Numerous climatic parameters are used in ecology, meteorology, etc. to characterise the climate in the individual areas.
  • However, since a model is a simplified representation of reality, 4 parameters were finally selected from 22 climate parameters.
  • The aim was to determine the future areas which would be climatically suitable for the studied butterfly, i.e. in which, for example, the same temperature and precipitation conditions could be present in the future as at the present sites.
Verbreitungsgebiet des Zitronenfalters
Locations of the Brimstone butterfly in the period 1981-2002 (Settele et al. 2008). Each point refers to an area of 50x50 km2.
Calculated distribution area in the year 2000 (climatically suitable).

The following parameters were selected to describe the climatic niches:

  • Range in annual temperature (°C)
  • Range in annual precipitation (mm)
  • Growing degree days (°C)
  • Soil water content (%)

The following pages describe these parameters.

Annual temperature range(°C)

  • Difference between the hottest and coldest month of the year
  • Jährliche Temperaturdifferenz (°C)
    7,4 - 13,8 °C 13,9 - 17,6 17,7 - 21,0 21,1 - 24,7 24,8 - 29,9
    Mean values for the time period from 1971 to 2000 (Settele et al., 2008)

    Annual precipitation range (mm)

  • Difference between the wettest and driest month of the year Jährliche Niederschlagsdifferenz (mm)
    13 - 44 mm 45 - 67 68 - 99 100 - 153 154 - 283
    Mean values for the time period from 1971 to 2000 (Settele et al., 2008)
  • Growing degree days (°C)

  • Each plant needs a certain amount of heat (also called degree of growth days) to develop.
  • Wärmesumme (°C)
    1 - 921 922 - 1420 1421 - 1918 1919 - 2393 2394 - 4432
    Mean values for the time period from 1971 to 2000 (Settele et al., 2008)

    Soil water content (%)

  • is determined for the upper horizon (upper soil layer, usually the more deeply rooted area)
  • Wassergehalt des Bodens (%)
    4,2 - 29,3 % 29,4 - 40,0 40,1 - 50,9 51,0 - 65,5 > 65,6
    Mean values for the time period from 1971 to 2000 (Settele et al., 2008)

    1. Annual temperature range

    The calculation is carried out according to the formula:
    ΔT = Tmax,m - Tmin,m
    Tmax,m - mean temperature of the hottest month
    Tmin,m - mean temperature of the coldest month

    Example:
    • Annual temperature range 2015 in Halle/Saale: ΔT=20°C
    • Warmest month was August: Tmax,m= 21,5°C
    • Coldest month was February: Tmin,m=1,5°C
    (http://klima.geo.uni-halle.de/statistik/campus/2016/)

    This is how the annual temperature ranges could change until 2080 (Settele et al., 2008):
    Time period from 1971 to 2000
    Year 2080 (Scenario YELLOW)
    7,4 - 13,8 °C 13,9 - 17,6 17,7 - 21,0 21,1 - 24,7 24,8 - 29,9
    In which direction will the annual temperature range in Germany change until 2080?
    ×

    Unfortunately wrong! Look at the picture again.

    ×

    Unfortunately wrong! Look at the picture again.

    ×

    Right! The extremes are increasing, so the differences between the coldest and hottest months are also increasing.

    2. Annual precipitation range

    This is how the parameter is calculated:
    ΔN = Nmax,m - Nmin,m
    Nmax,m - mean precipitation of the wettest month
    Nmin,m - mean precipitation of the driest month

    Example:
    • In 2016 the annual precipitation range in Halle/Saale was ΔN=72mm
    • Wettest month was July: Nmax,m=89 mm
    • Driest month was February: Nmin,m=17mm
    (http://klima.geo.uni-halle.de/statistik/campus/2016/)

    This is how the annual precipitation ranges could change until 2080 (Settele et al., 2008):
    Time period from 1971 to 2000
    Year 2080 (Scenario YELLOW)
    13 - 44 mm 45 - 67 68 - 99 100 - 153 154 - 283
    Use the figure to determine where the differences in precipitation will increase in Europe.
    ×

    Unfortunately wrong! Look at the picture again.

    ×

    Unfortunately wrong! Look at the picture again.

    ×

    Right! In Western and Northern Europe the differences between the extremes will increase.

    3. Growing degree days (cumulated temperature values)

    gdd

    For the growing degree days or "Heat sum", the gdd values of each day are added.

    gdd=(Tmax+Tmin)/2-Ts
    • Tmax Maximum daily temperature
    • Tmin Minimum daily temperature
    • TsThreshold value at which the metabolism of the plants starts, in this case 5°C.

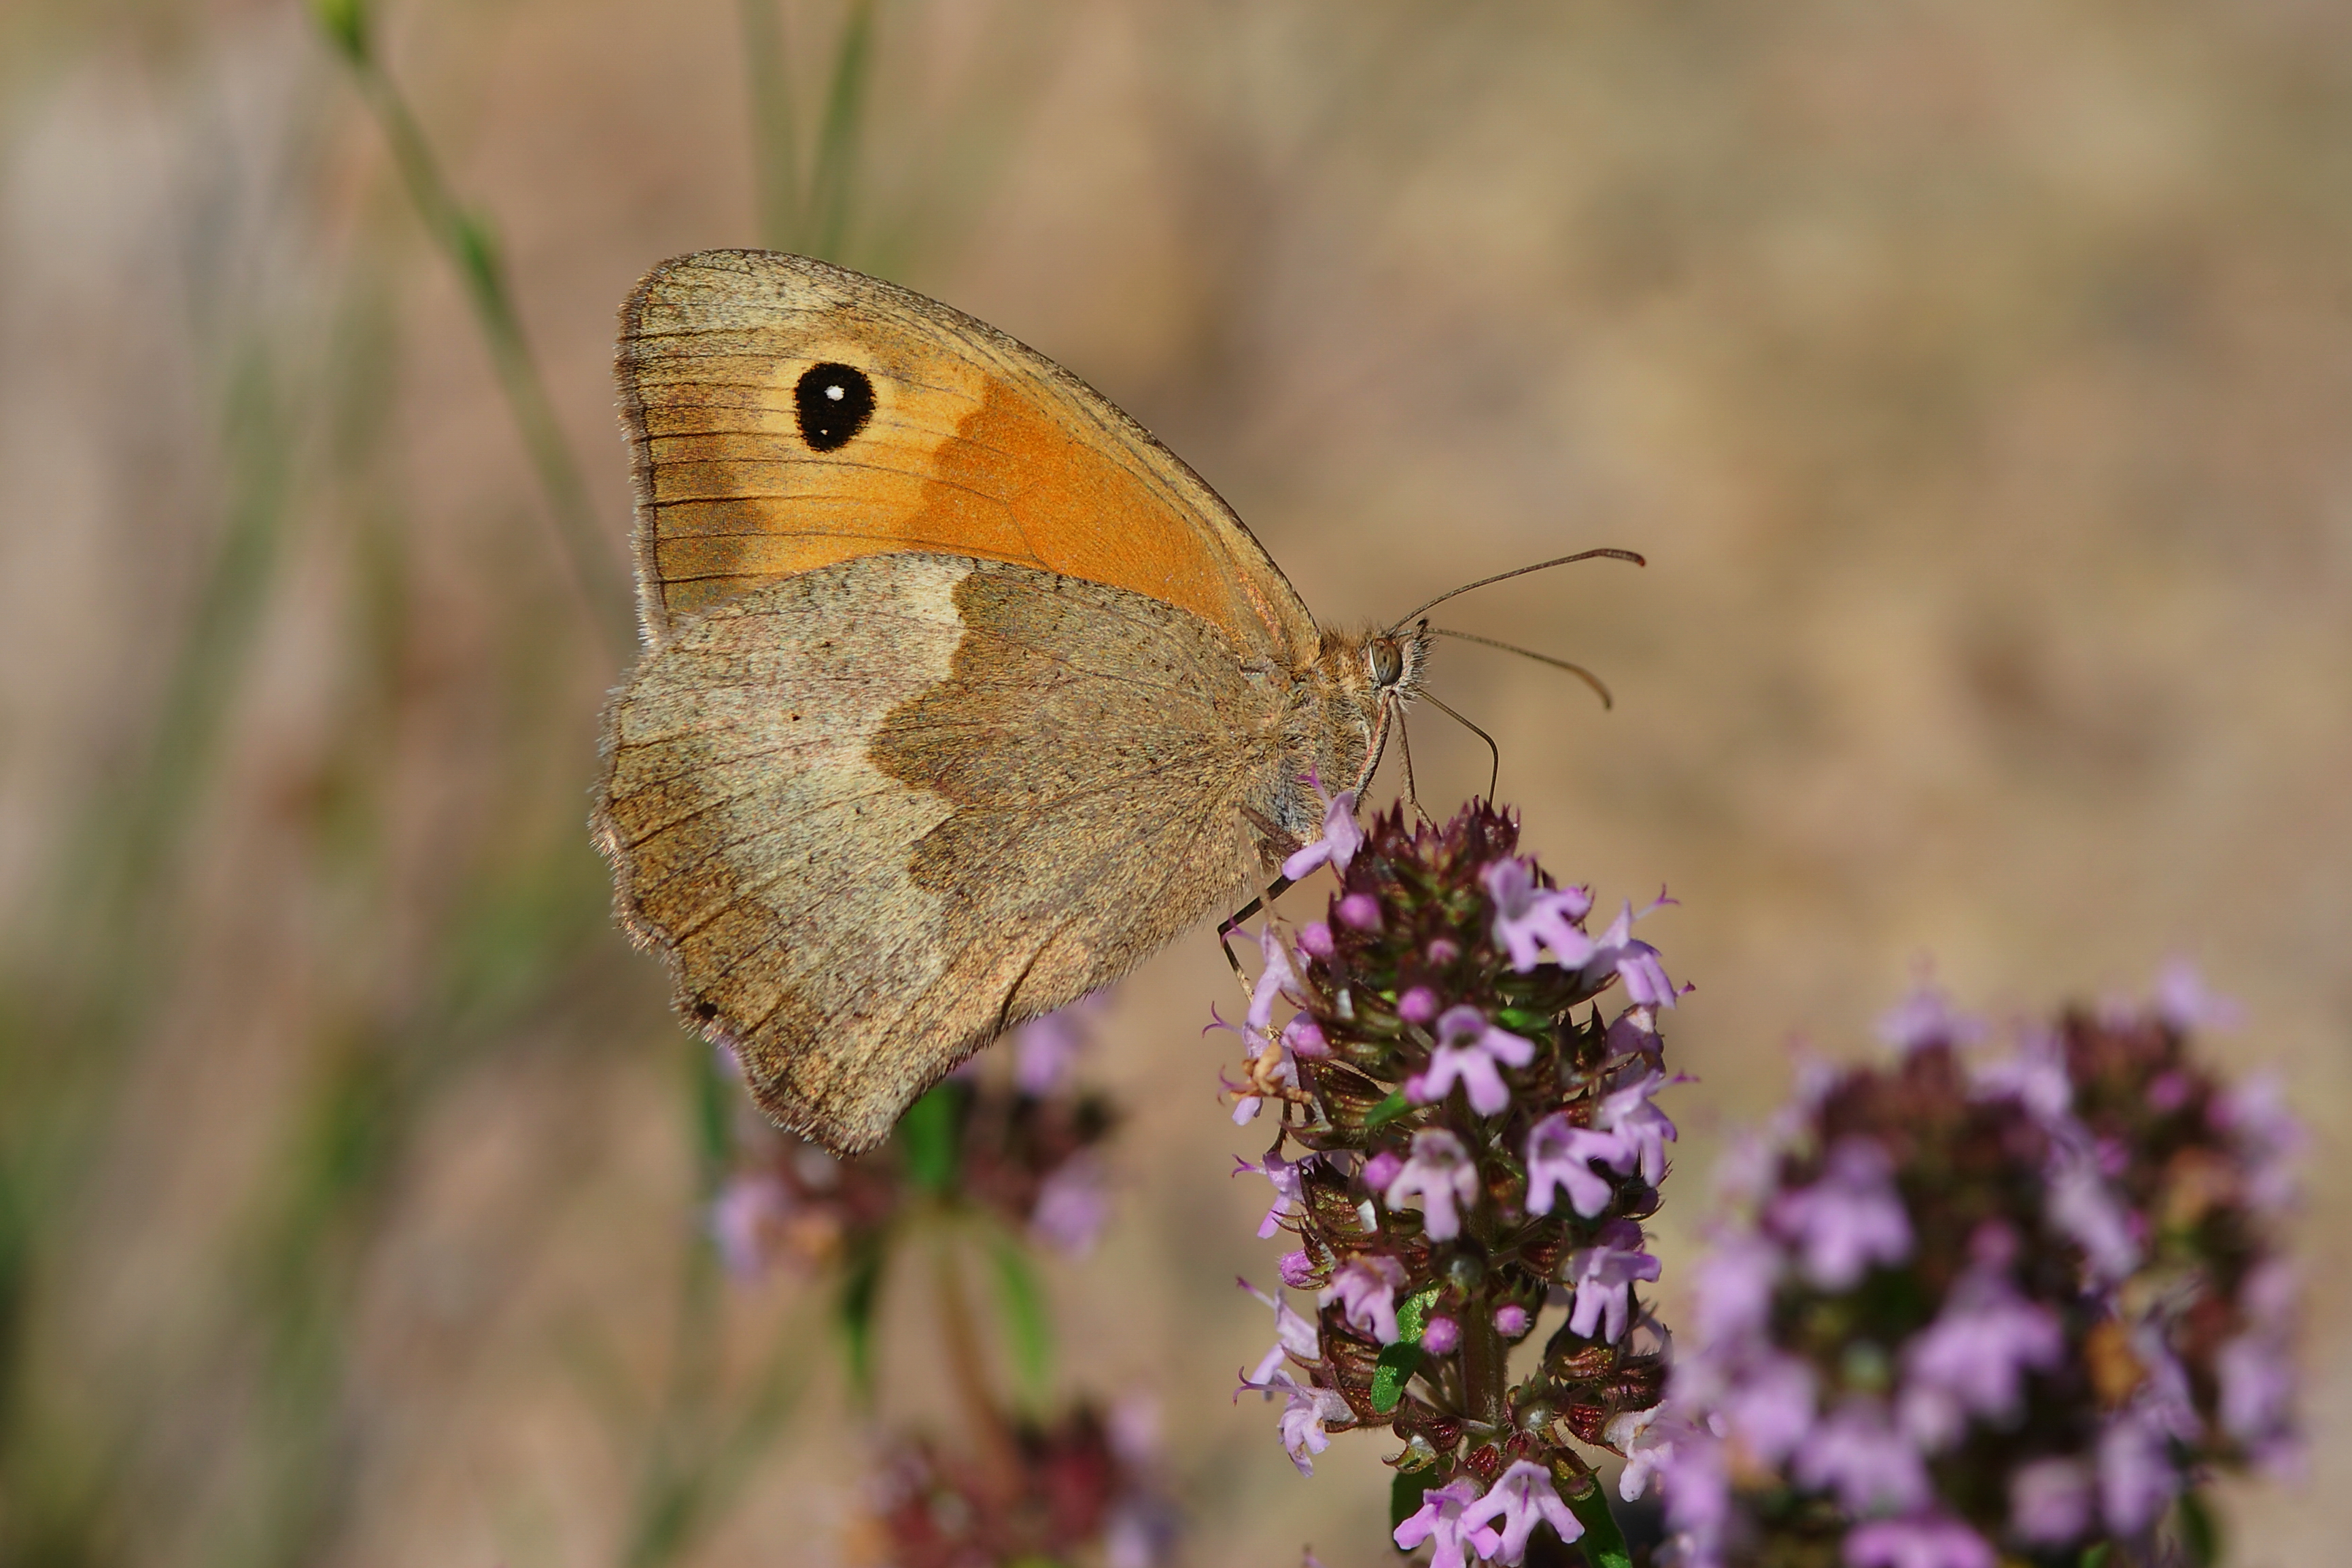
    Example: The butterfly lilac Buddleja davidii blooms only when a heat sum of 550 to 650 is reached. That applies in Germany to the month July - sometimes the value is already reached at the beginning of July, sometimes only at the end of July.

    This is how the heat sums could change with climate change (Settele et al., 2008):
    1 - 921 922 - 1420 1421 - 1918 1919 - 2393 2394 - 4432
    Time period from 1971 to 2000
    Year 2080 (Scenario YELLOW)
    How much heat does a single day with a maximum temperature of 23 °C and a minimum temperature of 12 °C produce? gdd=(Tmax+Tmin))/2-Ts (Ts=5°C)
    ×

    That's not right... Do the math again!

    ×

    Das ist nicht richtig... Rechne noch einmal nach!

    ×

    Good calculations!

    4. Soil water content

    swc

    The soil water influences the exchange of water and energy between soil, vegetation and atmosphere. However, the water content of soil can vary considerably depending on soil type, climatic conditions and patterns of use. The swc value is determined for the upper horizon. This is the upper soil layer, usually the more deeply rooted area.

    This is how the soil water content could change with climate change (Settele et al., 2008):
    Time period from 1971 to 2000
    Year 2080 (Scenario YELLOW)
    4,2 - 29,3 % 29,4 - 40,0 40,1 - 50,9 51,0 - 65,5 > 65,6
    Soil water content for the upper horizon (%)
    Find out which of these parameters are used to calculate the climatic niches.
    ×

    Well combined! These are the annual temperature range and the annual precipitation range, which together with the parameters Growing degree days and Soil water content describe the climatic niche.

    ×

    That’s wrong. Check your answer.

    ×

    That’s wrong. Check your answer.

    The climatic niches are thus described here by 4 parameters. But a 4-dimensional space would overstrain our imagination.
    Lesser purple emperor Apatura ilia
    Therefore a "trick" is used, which we demonstrate using the example of the Lesser purple emperor.
    In the first step, we create a

    2D graphic

    It shows which combinations of soil water content swc and heat sum gdd are suitable for the butterfly.
    suitable
    unsuitable
    transition area
    modelled boundary
    Second step:

    3D graphic

    For four values of the Annual temperature range ΔT such 2D diagrams are now produced: for the Minimum Min, for a "Small" value (also called "lower tertile"; only 33% are smaller), for a "Large" value ("upper tertile"; only 33% are larger) and for the Maximum value Max.
    Min Small Large Max
    suitable
    unsuitable
    transition area
    modelled boundary
    Third step:

    4D graphic

    How warm and humid it must be for the butterfly (expressed by the heat sum gdd and the soil water content swc) also depends on the other values: For mean values of ΔT the favourable range is larger than for the extreme values.
    Climatic niche of the Lesser purple emperor
    Use the climatic niche of the Lesser purple emperor to check which conditions are least suitable for him.
    ×

    Unfortunately wrong! Take a close look at the picture again.

    ×

    Unfortunately wrong! Take a close look at the picture again.

    ×

    That's right. The Lesser purple emperor does not feel well at relatively constant temperatures.

    Tagpfauenauge
    Peacock butterfly Aglais io
    Climatic niche ofA. io
    Gr. Ochsenauge
    Meadow brown Maniola jurtina
    Climatic niche of M. jurtina
    What is the difference between these two climatic niches? Describe the best and worst conditions for each butterfly.
    Find out which butterfly copes better with large temperature differences.
    ×

    Unfortunately wrong! Take a look at the picture again.

    ×

    Unfortunately wrong! Take a look at the picture again.

    ×

    That's right! The Peacock only has problems with large temperature differences (e.g. very cold April and very hot July) if the precipitation differences are high.

    Climatic niches can therefore be represented as graphs showing the parameter space of the four climatic factors described.
    But where in Europe will the climatic niches be for the individual species in the course of climate change?

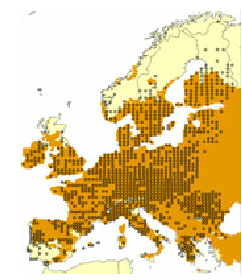
    Where will the Brimstone butterfly occur in 2080?

    To answer this question, Europe is regarded as a grid of cells with sizes of 50x50 km2 each. The future climatic conditions are calculated for each cell - in annual steps and for each of the three scenarios GREEN, YELLOW and RED. This shows which areas are suitable or lost for the butterfly according to the assumptions.
    Klimanische Zitronenfalter
    Climatic niche of G.rhamni
    Szenario Grün
    Scenario GREEN
    Szenario Yellow
    YELLOW
    Szenario Red
    RED (Year 2080)
    remaining climatically no more suitable newly suitable

    Modelled distribution area of G.rhamni

    Which image does the text belong to?
    Click on the correct number below the text.
    1_____________________2________________3
    Verbreitung Gonepteryx Rhamni
    Klimanische
    Szenario Red
    In 2050 many areas for the Brimstone butterfly could be lost (Scenario RED). This is where the Brimstone butterfly currently occurs in Europe. This is the climatic niche of the Brimstone butterfly.
    1 2 3 1 2 3 1 2 3
    Back